
I’ve been seeing the smog back above Los Angeles. It’s thick and tan, hanging up to the height of the mountains. Whatever it is seems to stick to the city, or the city’s making so much of it that it never dissipates. I wanted to take some time to understand how much pollution I’m actually seeing – is this much more than when I couldn’t see it, last year?
I had noticed pollution at times before (what Angelino hasn’t?), but hadn’t understood many of the terms and measurements. I also never really kept track of the levels and compared them to what I was seeing. But times, they are a changin’. I wanted to know what the current level of pollution is, as well as dive into what the lows were like during the deepest portions of the lockdowns. The skies were clear for a good long while, and I miss that. Consider a brief and probably miss-paraphrased statistic: the pollution lows we saw during the lockdowns were similar to the effect of half the world population driving electric cars.
Covid really started slowing down operations in February or March for most of the world. This pressed on until May or so, when restrictions started lifting nearly everywhere. Some of the worst-affected areas saw restrictions continue… and saw people ignoring them in larger numbers.
The first reported case in Los Angeles was on January 25th. A state of emergency has been in place since March 4th, 2020. The stay-at-home order went into place March 19th. In May, portions of California began to reopen, and have been operating on and off since. Cars and other forms of travel followed the same routine. Less planes flew through LAX during the spring than almost any other time in recent history. The freeway was open and clean, no matter the time or direction. The air had a chance to breathe.
The infection numbers tumbled up and down – mostly up for a long time, and again recently. During the worst of the onset, many industries around the globe closed up operations. This was either due to government actions, a lack of work, or a lack of customers. Pollution plummeted across the world, and quite visibly here in LA.
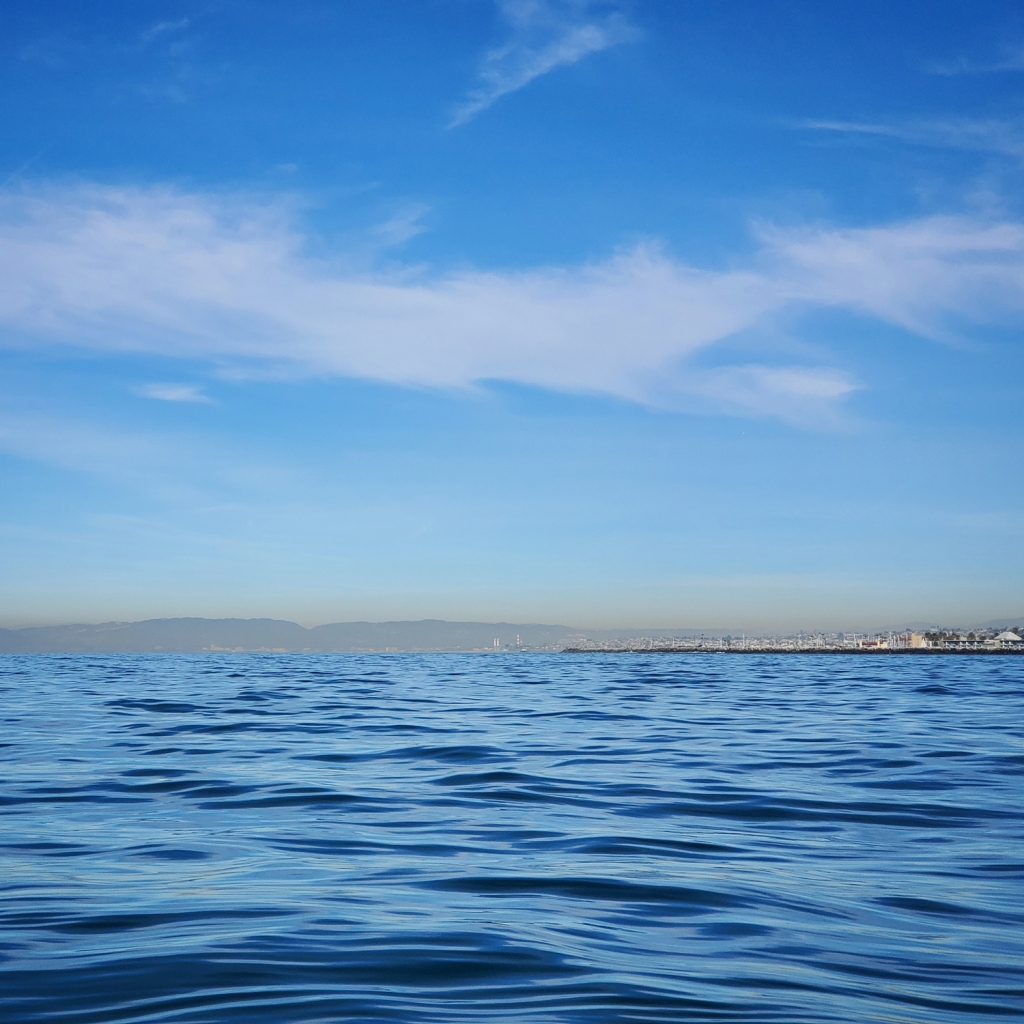
Then, months after the stay-at-home orders began lifting, the smog is back in LA. Lately, it’s gotten so bad that sometimes you can’t see that there’s mountains over there. Right now I’d expect there to be relatively normal levels of pollution, if not still a little lower than normal. Why does the skyline look like it does? And is everyone else on the world experiencing this bounce back of pollution?
The Spring
After accounting for the effects of meteorological variability, we find declines in the population-weighted concentration of ground-level nitrogen dioxide (NO2: 60% with 95% CI 48 to 72%), and fine particulate matter (PM2.5: 31%; 95% CI: 17 to 45%), with marginal increases in ozone (O3: 4%; 95% CI: −2 to 10%) in 34 countries during lockdown dates up until 15 May.
PNAS
Lockdowns are imposed in more than 89 countries, and affect half the world’s population. Different locations had lockdowns of different effects and lengths, but the heights of the lockdowns ranged from February to May. Los Angeles saw stay-at-home orders and reductions in industry and travel from March to May, with some effects carrying on long after.
Shutdowns and restrictions result in a 30-40% reduction in total output across affected economic sectors. Travel is affected the most, nearly up to 100% in many areas. Declines in business are largely unaffected by shelter-in-place orders; cities without these policies see only 10% more business than areas with restrictions. There is an overall 60% decline in normal business activity, as concluded after tracking 2.5 million cellphones. The week of April 12 is the lowest point seen in business, with a 70% drop overall.
CO2 production drops as more people are confined to home. Later studies reveal this reduction may have been a minor blip in an otherwise upward trend, though time will tell. CO2 remains in the air for centuries and in the oceans for even longer, slowly adding to and removing from a large bank of carbon in the atmosphere. The amount of CO2 in the atmosphere is constantly fluctuating due to carbon-sinks (like vegetation) that go through seasonal cycles. In 2019 the global CO2 concentration crossed the 410 ppm threshold, something we haven’t seen in 3-5 million years. Other greenhouse gasses, such as methane, are also largely unchanged, as energy production and animal digestion continue unabated.
Summer
The Global Carbon Project estimated that during the most intense period of the shutdown, daily CO2 emissions may have been reduced by up to 17% globally due to the confinement of the population. As the duration and severity of confinement measures remain unclear, the prediction of the total annual emission reduction over 2020 is very uncertain.
WMO
Pollution levels rebound from their lockdown lows. Major cities – Los Angeles, New York, Beijing, Madrid, Cape Town, and many others – saw a jump of 25% or so in their PM2.5 levels since the low point for 2020. This is a partial pullback from the April and May depths of the lockdown, when cities saw a 59% decrease in particular matter. PM2.5 is a measurement of fine particular matter in the atmosphere, 2.5 microns or less (about 1/30th the width of a human hair), and must be measured by ground sources. According to the EPA, these particulate levels have lowered bit by bit over the last 20 years, but the COVID lockdowns caused a massive drop. After the lockdowns ended, some cities saw continued decreases from their lockdown lows, such as Hong Kong (127%), Sydney (35%), and Singapore (23%). PM2.5 has a complex source structure, and not all its sources were affected equally. It will be some time to understand how and why these levels have changed in such ways… but it’s good news nonetheless.
Air pollution is the fifth leading risk factor for mortality worldwide. Ambient air pollution contributes to about 5 million deaths annually – 1 in 10 deaths. It’s above the numbers for car crashes and malaria. Pollution irritates breathing pathways and can sicken the body in general, making people more susceptible to COVID and other diseases, or worsening the effects (this is still being studied, along with everything else mentioned in this article).
Fall
When viewed broadly and globally, air pollution dropped during the lockdowns. A study based on data from satellites and more than 10,000 ground-based monitoring stations around the world found that average global air quality during lockdowns improved relative to the same periods in 2019
c&en
By November, NASA was reporting that nitrogen dioxide levels had fallen 20% beneath expected amounts. They cited the changes as largely driven by the shutdowns starting in February. Their modeling was built to account for the normal way that atmospheric nitrogen can change based on atmospheric conditions and seasonal factors, to help ensure that any change is meaningful. Nitrogen dioxide is mostly produced by vehicle exhaust and industrial fossil fuel use – about 45-50% of NO2 emissions. Cities, concentrated areas of these production sources, showed between a 20-50% reduction in NO2 levels in their metropolitan areas. Some cities, such as Wuhan and Milan, showed a 60% decrease from their expected springtime levels.
Carbon dioxide produced by burning fossil fuels has a distinct isotopic signature. Grasses that absorb CO2 readily were examined to determine the effects of a sudden drop in carbon dioxide. By examining the grass from 120 scientists’ lawns in New Zealand, they determined that fossil fuel-related CO2 dropped by just as much as traffic had in the area: about 80% at the height of the lockdown. This confirms how and how quickly the carbon from fossil fuels can potentially be cycled.
Studies conclude that fine particular matter in the air dropped 31% during the lockdown periods. At the same time, global average ozone went up slightly. The relation between ozone production and other pollutants is still being researched, as different environmental reactions take place across the globe.
These scenarios have given climate scientists the chance to study never-before-seen phenomena; What happens if all traffic is halted? Can the climate reset if everything is turned off? Do pollutants settle out of the atmosphere at the expected rates?
Winter
Once the air-cleansing March weather went away, [Los Angeles] plunged into a late spring and summer with intense heat waves that contributed to the worst ozone pollution readings and highest number of bad air days since the mid-1990s. Smog hit abnormally high levels throughout the region, from inland areas to the coast. By fall, the state had experienced the worst and most widespread bout of health-damaging wildfire smoke on record.
LA Times
In all, this year there were 157 bad air days for ozone pollution — the invisible, lung-searing gas in smog — across the vast, coast-to-mountains basin spanning Los Angeles, Orange, Riverside and San Bernardino counties. That’s the most days above the federal health standard since 1997.
In 2020, there were 22 climate disasters totalling $1b or more in damages in the US. These events included 1 drought event, 13 severe storm events, 7 tropical cyclone events, and 1 wildfire event. The drought and wildfire were on the western half of the US, while all the storms were on the eastern half (and fairly well spread out). Most events happened in spring and summer (April – August, specifically), though some events were longer-lived than others. This year broke the previous record of 16 events, and is the sixth consecutive year in which there’s 10 or more events costing $1b or more. This year’s totals amount to $95b, with tropical cyclones and severe storms taking $40b and $34b respectively. The 1 wildfire breaking the $1b barrier cost about $16b (The August Complex was the largest California wildfire, which began as 37 separate wildfires within the Mendocino National Forest), while a single drought managed around $5b. The NOAA began tracking these events in 1980, and has recently begun reviewing their information collection policies. They’ve decided they’re underestimating the impacts of some of these events by 10-15%.
Yearly global greenhouse gas emissions are projected to be only 4-7% less than normal, due to the shutdowns.
If COVID has brought about a reduction in climate disasters of untold proportion, that’s something we’ll have to learn about in the coming years.
Unfortunately, I’ve also come across the confirmation I was looking for. If I blame it on confirmation bias, can I ignore this?:
Los Angeles had 21 smog-free days in 2020. Let’s start off by realizing that 365 minus 21 is still a really big number of smoggy days. Nearly half the year were considered bad days for air pollution. Wildfires and uncooperative weather coupled with the resuming traffic to really give our lungs a mouthful. COVID, at the end of the day (and year) really didn’t help clean up the air here.
It’s the start of the new year. Spring starts in a month or so. We’ve had an election, which went surprisingly smoothly considering how tumultuous the process had been just a couple weeks earlier. Right at the start, a number of environmental directives changed or went back into effect – The Paris Climate Accord is back in the mix, and something like 100 other environmental actions under Trump are being re-examined. A new directive requires a sign-off on new oil and gas lease or drilling activity, which is apparently slowing down 400 drilling permit applications. There is now a moratorium on drilling in Alaska’s Arctic National Wildlife Refuge. Biden is apparently also looking at existing legacy pollution, which is something I’ve only heard of just recently.
It’ll take time to see how these changes pan out; whether they’re passed and accepted, whether they’re enforced, and whether other changes or accidents override the effects. Anything’s possible, as we’ve seen throughout the years.
Conclusions?
Like many aspects of the climate debate, only time will tell what the outcomes will be. During the height of the lockdown, air quality – chemically – improved almost immediately. NO2 and CO2 (from fossil fuels) both decreased, mostly in tune with the reduction in traffic and worldwide shipping. This effect was noticed most heavily in major cities, though arguably the whole world benefitted. Fine particulate matter, PM2.5, similarly dropped, though some cities are working hard to keep it down. On the side of natural disasters, where the US is not alone in the scale of its disasters, the storms have not abated. If anything, this was one of the worst years we’ve ever seen. Hopefully, time and clear skies will help the scale of these catastrophes subside.
In the end – the air’s nice, but the weather’s been better. Except in LA, where the air is pretty bad too.
Currently, California cities hold 7 out of the top 10 spots for ozone pollution, spots 1 through 5 in year-round particle pollution, and the top 3 spots in short-term particle pollution. Among the worst areas in the United States for all 3 metrics are Los Angeles/Long Beach, Visalia, Bakersfield, and San Jose/San Francisco/Oakland.
Thanks for stopping by! I hope you had a pleasant time checking out the plants. If you’re in the mood for more nature, please stay in touch!
